From Clicks to Calls: Using Analytics to Optimize Your WooCommerce Phone Order Process

The success of any online business depends heavily on their ability to capture and convert customers. However, if your WooCommerce store is not optimized for phone orders, you could be missing out on a valuable source of revenue. In this article, we’ll discuss how you can use analytics to optimize your WooCommerce phone order process and turn clicks into calls.

What should you pay attention to in analytics?

Analytics provide valuable insights into customer behavior and website performance, allowing you to identify areas of your website that need improvement in order to boost conversions. Here are a few key analytics metrics to pay attention to when optimizing your site for phone orders:

  1. Bounce Rate

This metric tells you the percentage of visitors that leave your website after viewing only one page. A high bounce rate can indicate that visitors are not finding what they need on your website or that your website is difficult to navigate.

  1. Conversion Rate

This metric shows the percentage of visitors that complete a desired action, such as making a purchase or signing up for a newsletter.

  1. Traffic Sources

This metric tells you where your website’s visitors are coming from. Paying attention to this metric can help you identify which traffic sources are the most effective and where you should focus your marketing efforts.

  1. Customer journey

Analyzing the journey of your customers from their entry on your website to the purchase can help you understand where they’re dropping off and identify any areas of improvement.

  1. Device usage

Monitor the type of devices your customers use to access your website. This can help you optimize your website for different device types and ensure that your pages are optimized for mobile users.

How can you apply the obtained analytics?

Now that you know which of your settings are below or above the recommended level, you want to figure out how to fix them.

If you have a high bounce rate, then make your site clear.

The reason for the lack of calls is often found in the design. If a web page is poorly laid out, then it is unlikely to inspire confidence. It’s even worse when the site does not contain the necessary information: prices, contacts, tariffs and the products themselves. Or all the pages are filled with “water”, and the texts contain grammatical and punctuation errors.

In order to fix this, you need to invite a specialist or edit the site yourself. What to pay attention to and check:

  • Legible font;
  • Site navigation;
  • The telephone numbers are operating normally;
  • The site looks well-maintained, as does its mobile version, the images are of good quality;
  • Contact information;
  • The product offer is competently and clearly designed;
  • All links work correctly;
  • The site doesn’t take too long to load;
  • The content corresponds to the expectations from the advertisement seen.

Thanks to these actions, you can achieve a low bounce rate, but also ensure that the customers reaches the end of the purchasing journey.

If you have a low conversion rate, then set up contextual advertising correctly.

Of course, if you have any. And if so, perhaps you have a situation where you have clicks but no conversions. Why does this happen?

There are two key points: whether the ad itself is well set up and the page to which it leads.

The task of contextual advertising is to “reach out” to representatives of your target audience (potential clients) and show them your advertisement. If your ad attractes them, they will click on it and go to your landing page. Next, they will see your page, which should continue the advertisement that the person clicked on, present the company and its main offer, involve in studying the page, close all key objections, build trust, show the assortment, lead to the main or intermediate conversion.

Does everything seem easy and impossible to make a mistake? But nevertheless, if you relax at the moment of setting up the ad, you will get a completely uninterested audience.

What should you do to avoid this?

First of all, remove non-target key phrases. For example, if you provide any non-free services, then you do not need to include “we will provide the service for free” in your phrases. Another example when a phrase can be understood in a different sense. You may have your own business in the quiz, and if you add “quiz for lady” to your key phrases, then you will face the fact that you will not get conversions, since your phrase is essentially the name of the movie (quiz lady). Users searching for this phrase obviously want to watch a film.

There is also another problem with key phrases – their incorrect grouping. Let’s look at the example of an online store of women’s dresses. Unprocessed queries and all phrases, in particular regarding types of dresses, lead to one page – the main page. When typing “stripe dresses”, the user expects to see only striped dresses. In this case, it was worth dividing the phrases into groups (polka dot dresses, mini dresses, etc.) and defining the corresponding page for each group.

Finally, the last but not least thing you can do is to target the right target audience who will see the ad. Most often, the analytical system attached to your website (age, region, behavior on the site) containes all information on your target audience.

If you have low conversions from mobile devices, then adapt your site.

More than half of Internet users from all over the world view web pages from a mobile phone, so it is important to adapt your landing pages, websites and other resources for the mobile user. This will help you avoid losing this audience due to the fact that it is inconvenient for them to read text or fill out a form.

How to adapt a website for mobile users to provide them with ease of use, registration, leaving an application and not lose in conversion:

  • Simplification of design and content

Get rid of design elements, without which the landing page will not lose its meaning and remain intuitive. Remove all images that take a long time to load, hide some elements under buttons (for example, “Show more”), discard the video embedded in the page (for example, on the first screen).

Make sure that the images you leave on the site match the width of the mobile screen.

In addition, try to compress images using special services – this will reduce their size without significant loss in quality.

  • Vertical scrolling and finger taps only

In order for the user to conveniently use the mobile version of the site, he must be able to do this with 2 simple movements – scrolling up and down and pressing a button.

If the user has to enlarge the text, scroll the page horizontally, or reach with his finger to press a button, he is likely to leave the landing page due to inconvenience of use.

  • One touch call

Instead of a contact button in the corner, it’s better to make it possible for the user to call a phone number on the landing page with one click. At the same time, it is desirable that the phone number also places conveniently, avoiding the extreme corners where it is difficult to reach.

  • Button on the first screen

According to statistics, 53% of sites where it takes more than 3 seconds to search for a button lose potential customers. This is too long. The CTA should be detected within 1-2 seconds. Ideally, the button for performing the target action should be located immediately on the first screen, without the need to scroll, easy to press with your thumb. It should be a contrasting color so that it is immediately noticeable.

  • Short application form

Do not overload the application form, especially in the mobile version. Filling it out is already difficult, and if there are many fields in it, the user will most likely not do it. Limit yourself to 1-2 really important fields.

What else can be optimized?

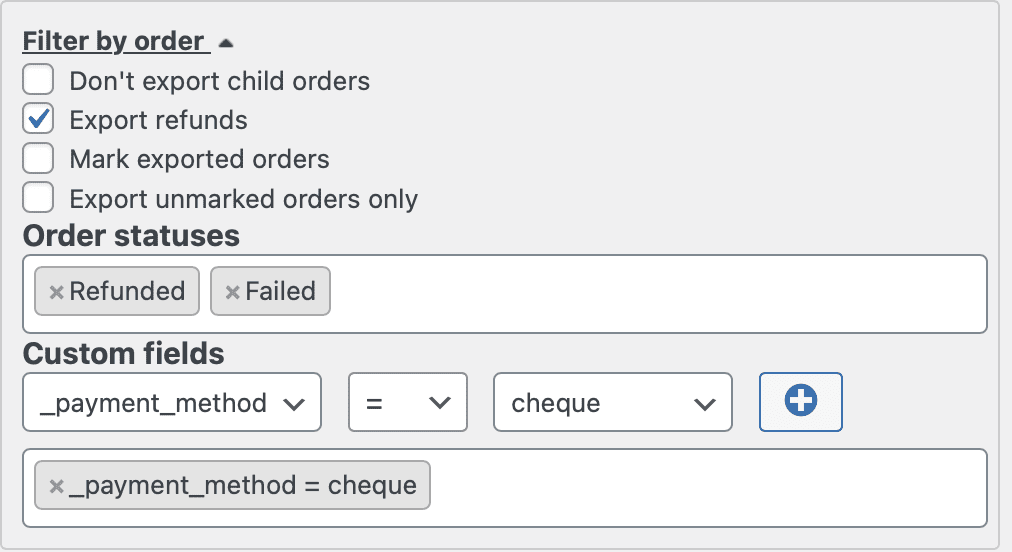
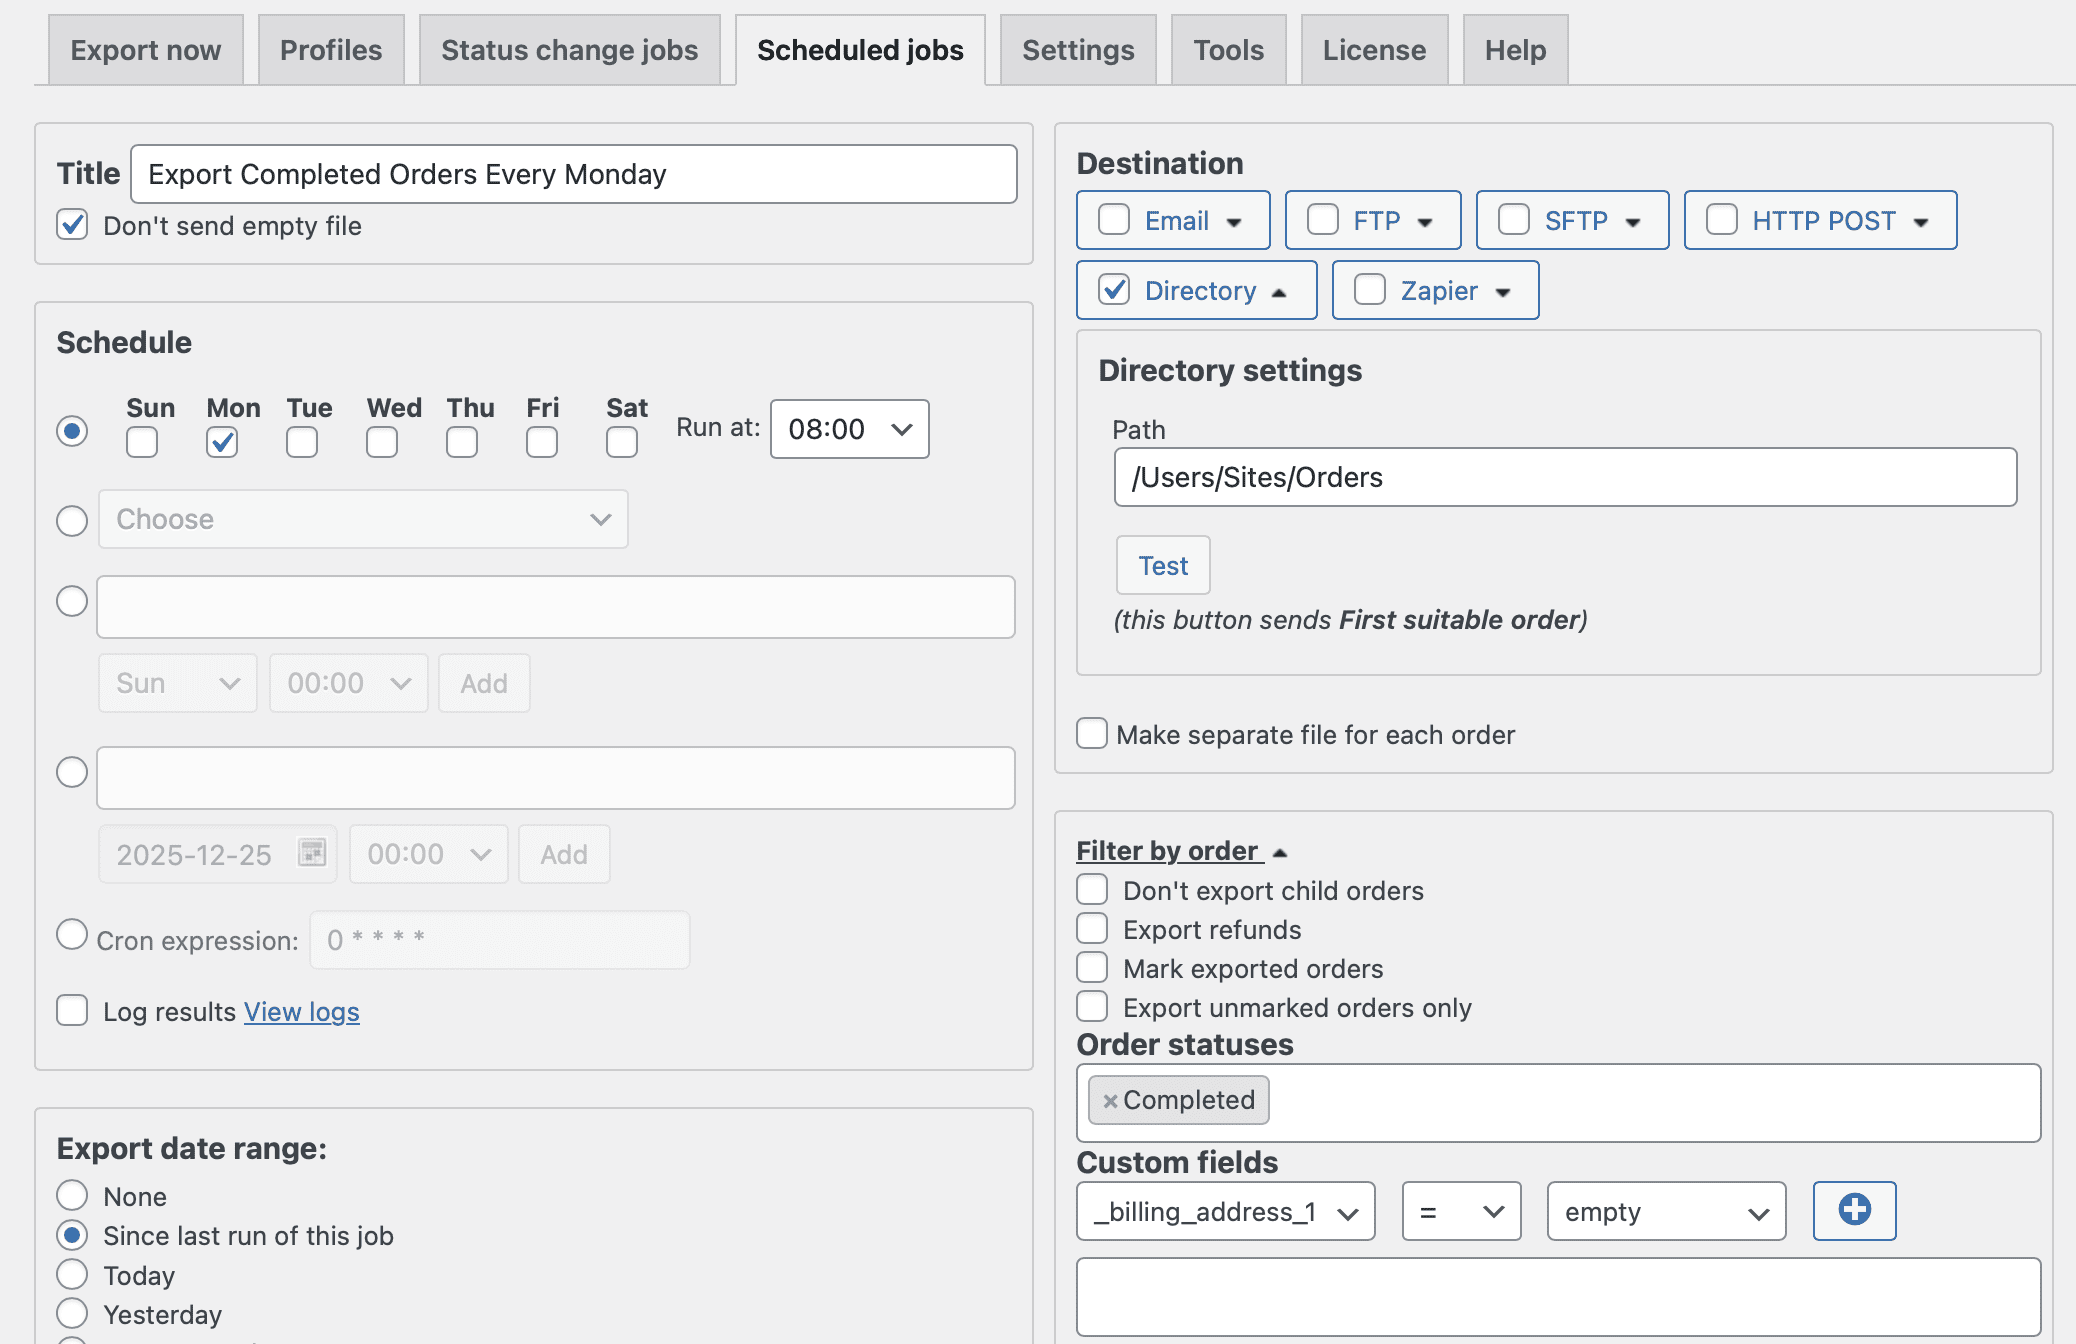
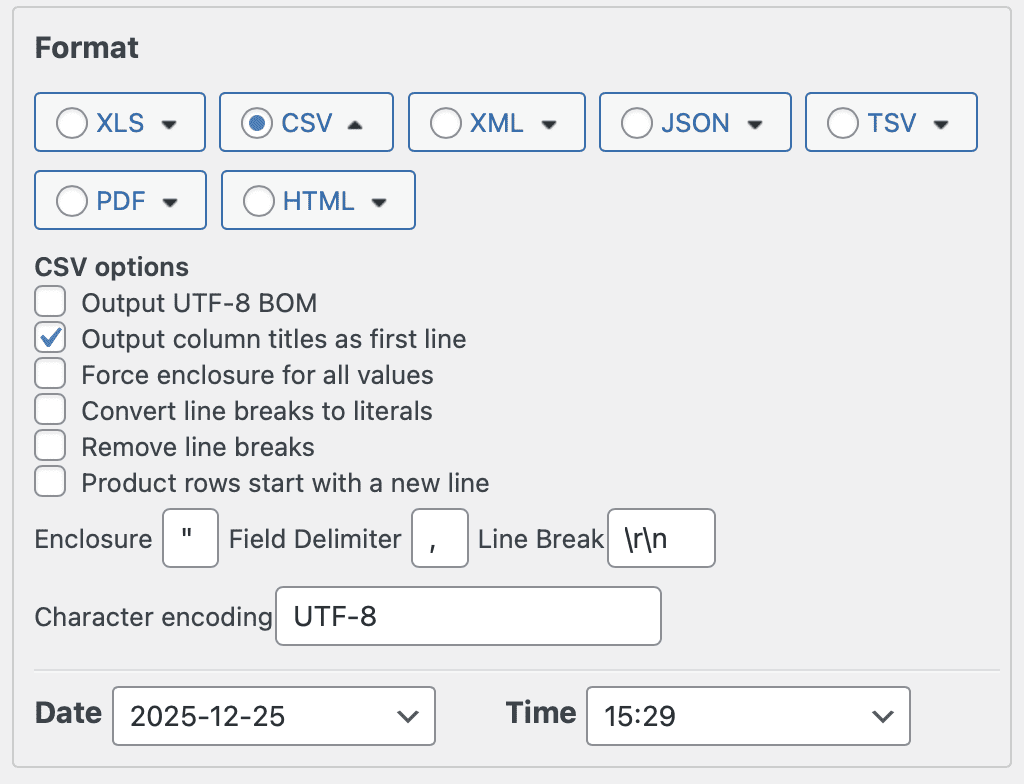
Optimize your phone order! The simplest way to do this is to use the phone order system. This systems make it easier to manage orders, track customer information, and process payments.

Phone Orders for WooCommerce is a great way to add more convenience to your customers. This plugin allows you to easily manage orders placed via phone. This gives you to quickly process orders from customers who may not have access to a computer, or who would prefer to call to place the order.

Among its main advantages:

  1. Intuitive interface.
  2. Possibility of use as a POS system
  3. Barcode scanner available
  4. Storing customer information
  5. Support composite/bundled/other complex products
  6. and more.

Phone Orders for WooCommerce is easy to set up and use. It takes just a few minutes to get started:

  1. Make sure your store runs on WooCommerce.
  2. Download and activate the plugin.
  3. Read about the order acceptance process.
  4. View our other articles about all the features of this plugin to customize it to the needs of your business.

If you’re a WooCommerce store owner, Phone Orders for WooCommerce is definitely something you should consider.

Finally, we recommend continuing to review your site analytics and monitor current trends in your area. Times change, and so do customer preferences. Your supply must match demand. Work on this and the result will not keep you waiting.

Halloween Sales Analysis

Halloween is in less than a week! I hope you are well prepared for it. If not, then read all about how to properly organize a marketing strategy during this period and get the maximum effect from its analysis.

Most purchased products and popular coupons

It’s no secret that on the eve of the holiday, the following products will be relevant:

  • Costumes. Who doesn’t want to dress up as their favorite hero? Thanks to the Barbie movie, many people will want to become the main character or Ken. A lot of revenue will come from this position.
  • Candies. Giving out candy has become a tradition on Halloween. Almost 70% of people definitely do this. Give customers discounts on buying candy in bulk to attract them.
  • Decor. Home decorating competitions are still a thing. Your competitors have already lowered their prices on terrible things. Do this too.

Create your own themed coupon and see how it affects your shopping habits. With Advanced Dynamic Pricing for WooCommerce plugin, this can be done with the snap of your fingers.

Specify which products will come with a discount, set its amount and come up with a name for the coupon. Find out which coupon names are the most common:

  • SPOOKY15
  • TRICKORTREAT
  • PUMPKIN
  • HAPPYHALLOWEEN25
  • MYCANDY20

Activate the coupon, inform your customers about it and wait for the peak of sales!

Why should you choose Advanced Order Export For WooCommerce for export?

Halloween is one of the most popular times of the year for retail stores. With the influx of shoppers and the high demand for costumes and decorations, it is important for store owners to keep track of their sales and analyze the data. Fortunately, Advanced Order Export for WooCommerce makes it easy to track your Halloween sales.

The plugin allows users to export customer data such as order IDs, customer names, billing and shipping addresses, order totals, and more. Additionally, the plugin also exports product data such as product IDs, product names, SKUs, prices, quantities, and discounts. This data can be used to analyze the store’s sales performance and gain insights into the most popular products.

Advanced Order Export for WooCommerce also provides you with a range of features that make it easy to customize your reports. You can choose which fields to include in your reports and even add custom fields that can be used to track specific metrics.

Note: To set up a coupon report, you need to add the following fields – Coupon Code and Discount Amount.

Note: Read our article for a detailed guide on exporting.

Finally, Advanced Order Export for WooCommerce allows store owners to export their sales data to other applications. With this feature, store owners can connect their WooCommerce store to third-party applications such as Google Docs and Dropbox. This allows them to easily view and analyze their sales data in different formats.

By what parameters should you analyze the data?

Halloween is over and you’ve received your sales reports. What to do next? Check whether your marketing hypothesis is confirmed. There are different indicators for this:

  • CTR (Click-through Rate)

CTR shows how accurately an ad responds to a user’s query and how attractive it is to the user.

The higher the CTR, the higher the ad quality score. Increasing ad quality while maintaining the same maximum bid increases the chances of getting a higher position. In other words, ads with a high CTR save money.

CTR = Clicks 100% / Impressions*

  • CPL (Cost per Lead)

A lead is a user who has shown interest in a product or service and sent his contact information (ordered a quote, requested a price list, asked for detailed advice, etc.).

CPL = Contextual Advertising Costs / Leads

  • CPC (Cost per Click)

The cost that an advertiser pays for clicking on an advertisement and then going to the site. CPC helps us evaluate the effectiveness of an advertising campaign and adjust bids. The CPC indicator is influenced by several factors – the ad itself, its quality score (CTR), the region of display, time, competitors showing ads for the same key phrases.

CPC = Advertising Cost / Clicks

  • CPA (Cost per Action)

Cost Per Action is used as an indicator of the cost of attracting one client or performing a targeted action.

CPA includes payment models such as: CPL (Cost Per Lead), CPV (Cost Per Visitor), CPI (Cost Per Install), CPC (Cost Per Click), CPS (Cost Per Sale), CPO (Cost Per Order ) and CPM (Cost Per Mile). This is due to the fact that CPA involves attracting customers with the ability to pay for any user action.

CPA = Advertising Cost / Targeted actions

  • LTV (Lifetime Value)

LTV is an indicator of the profit that a business receives over the entire period of working with a client. Customer Lifetime Value is considered one of the key values in marketing and e-commerce in general. The metric shows how much is spent on attracting, retaining, engaging and how much income the company receives from all this.

LTV = Average bill × Average operating time

  • ROAS (Return on Ad Spend)

It shows how profitable an investment in advertising is and allows you to measure the effectiveness of both an entire campaign and individual ads or a group of them, as well as keywords. Using it, you can determine the degree of payback according to the following principle:

  1. ROAS is less than 100% – the campaign is at a loss;
  2. ROAS is equal to 100% – the advertising paid for itself, but did not bring any profit (it went to zero);
  3. ROAS is more than 100% – the campaign was successful and brought profit.

Employees typically compare these metrics across multiple campaigns to determine the most profitable source. And all this is not calculated for a specific period, but for the entire time that the advertising was active.

ROAS = Advertising Revenue / Advertising Cost × 100

  • ROMI (Return on Marketing Investment)

This metric shows the return on marketing costs: advertising, website, SEO promotion, email campaigns, blog, and so on. ROMI takes into account only marketing costs, and does not include the costs of producing goods, employee salaries, or renting premises.

ROMI = (Marketing Revenue – Marketing Cost) / Marketing Cost × 100

  • ROI (Return on Investment)

The indicator demonstrates how profitable or unprofitable a project or product is.

Investments are a contribution directly to the business, that is, expenses for employee salaries, rent of premises, marketing, purchase of raw materials and materials, purchase of software and services necessary for work.

ROI = (Revenue – Cost) / Cost × 100

It is impossible to determine which of these parameters is best. The choice depends on the level of competition in the niche and the positions you want to occupy. Some indicators are not indicative for analytics in isolation from the context, so they must be calculated together with other metrics.

Testing and analysis the marketing hypothesis

The theory is over. Let’s start practicing!

In the previous paragraphs, we created a coupon in Advanced Dynamic Pricing for WooCommerce and uploaded a sales report using export. What data do we have? From the report we know information about our customer, his/her purchases and coupons. Let’s say our marketing hypothesis was:

“If you give a coupon for subscribing to the newsletter, your income will increase by 20%.”

Let’s take a look at the data from the report:

Order Number Order Total Amount Coupon Name
12345   1302   SPOOKY15  
12346   590   SPOOKY15  
12347   436      
12348   2098      
12349   377   SPOOKY15  
  Total amount: 4803      

Let’s imagine that last Halloween the income was 4000 dollars, then the percentage by which the income increased will be as follows:

(4803 – 4000) / 4000 × 100% = 20%

Our hypothesis is confirmed and income actually increased by 20% thanks to the coupon. But, as stated above, indicators do not work in isolation from each other, so let’s calculate other metrics to find out how effective our marketing hypothesis is.

How do users find out about the subscription coupon? Obviously, a simple ad on your site is not enough to achieve this. That’s why we launched contextual advertising in Google Ads. We also set up a goal in this application – a paid order.

The advertising cost was $200, there are 1000 impressions, there are 20 clicks, and there is 1 targeted visit. Based on this, we calculate CTR, CPC and CPA:

CTR = 20 / 1000 × 100% = 2%

CPC = 200 / 20 = 10

CPA = 200 / 1 = 200

There aren’t many impressions, but the CTR is excellent. 2% is an average value that shows that our advertising is relevant to users.

The CPC is $10, which is quite high for a cost per click. This means that advertising is carried out using popular keywords, where there is a lot of competition. But don’t panic. With the help of advertising, we attracted one client who carried out the targeted action – made an order. We don’t know who it was, but even so we can say with confidence that the advertising paid off and brought us at least $177 (we subtract the CPA value from the cheapest order with a coupon).

Let’s find out how profitable our hypothesis turned out to be.

ROI = (4803 – 200) / 200 × 100% = 2301.5%

Note: For simplicity, we do not include many types of expenses. In real life, you won’t get such a large percentage.

An ROI above zero indicates that the hypothesis is actually profitable. But is it more profitable than last year? In 2022, Halloween revenue was $4,000. Expenses included advertising our store – $50.

ROI = (4000 – 50) / 50× 100% = 7000%

Last year’s ROI is significantly higher than this year’s. However, this does not mean that the current marketing strategy is completely ineffective, since the net profit from it is:

4803 – 200 = 4600

and from the previous one:

4000 – 50 = 3 950

Thus, ROI should not be taken as an indicator of profitability. It only shows whether your investment is paying off. It is only important that its value is positive. As for the effectiveness of the marketing hypothesis, it turned out to be successful. Thanks to advertising, income increased by 20%, and 1000 users learned about our store! If we added other fields to the report, many more hypotheses could be analyzed. The possibilities for customizing reports in Advanced Order Export for WooCommerce are endless.

In this article, we examined in detail the process of analyzing Halloween sales using Advanced Dynamic Pricing for WooCommerce, Advanced Order Export For WooCommerce and various metrics. We wish you high results!